How To Check CPU Load/Usage
Monitoring your server’s CPU load may be important for you, which is why we made it easy to access your CPU usage information via the Heficed Terminal.
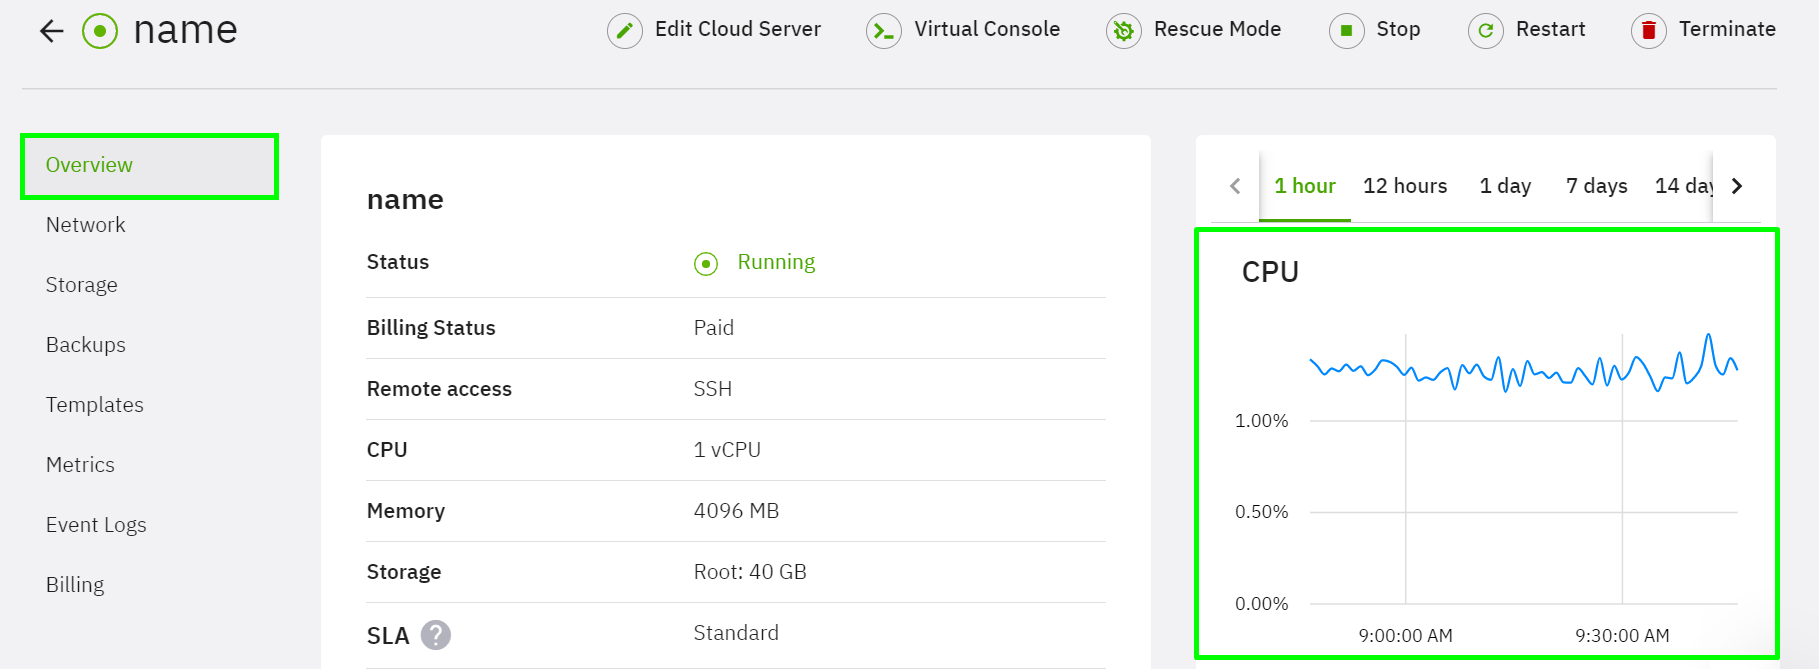
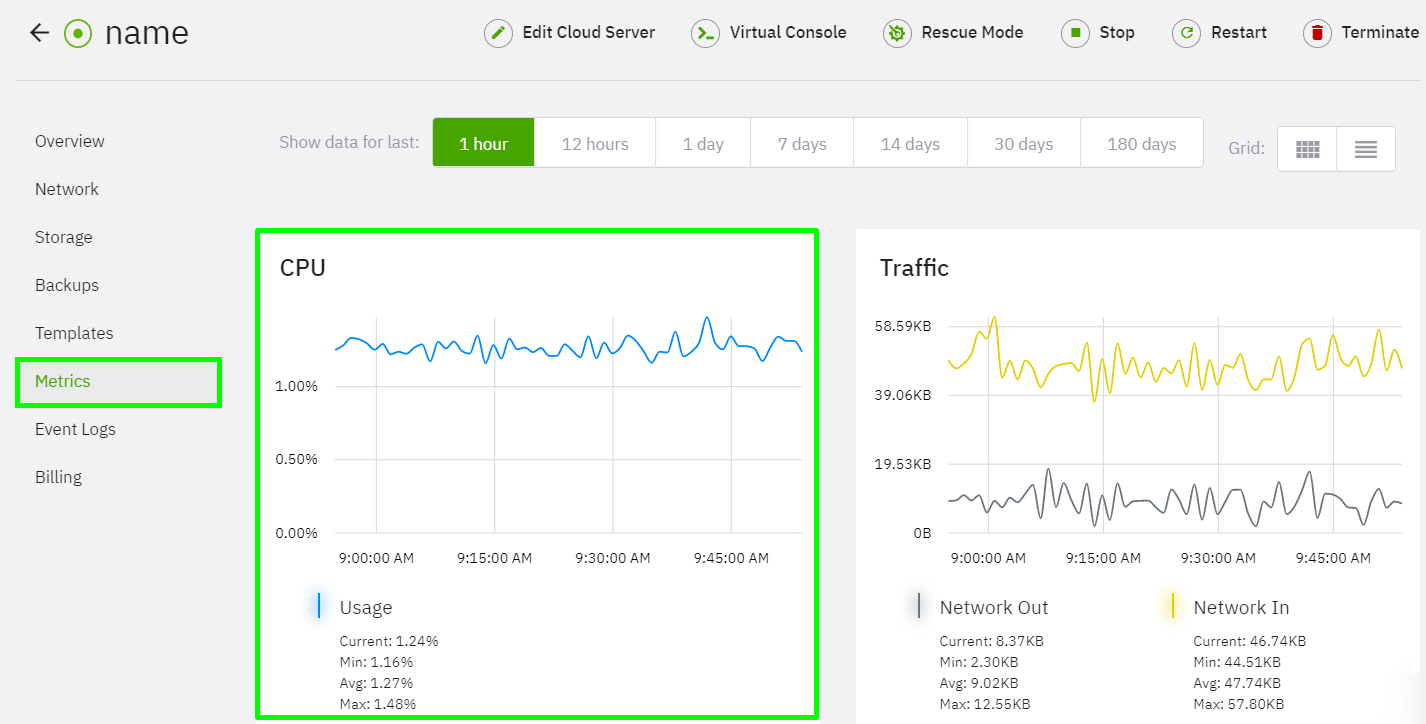
You can also go to Metrics to find more in-depth information.
Alternatively, you can check your CPU usage directly on your server.
CPU Load in LINUX
There are plenty of ways to check or monitor your CPU performance on a Linux server with the help of different tools, such as sysstat or htop.
By default, you can check real-time resource usage using the command:
# top
You can also add the -i parameter to prevent idle processes from being displayed:
# top -i
NOTE: You can exit viewing your resource usage by pressing q on the keyboard.
CPU Monitoring in Windows
External monitoring tools exist for Windows operating systems as well. However, it is easiest to check CPU usage via the Performance tab within Task Manager.
You can access the Task Manager via Search or using the CTRL+ALT+DEL key shortcut.
Alternatively, you can go to the Performance Monitor, which you can access directly via the Task Manager or Search.
Related articles:
Was this article helpful?
Need support?
If you need any further help, don't hesitate to send a support request to our support team.